
You see less air pollution. We see the future thanks to clean transportation.
One of the biggest and most immediate changes the emergence of COVID-19 has brought upon American society is the end of commuting. The vast majority of people are either working from home or don’t have a job to travel to.
Some of the most congested highways in the world, the 405 in Los Angeles, I-90 in Chicago, and I-95 in New York, are emptier during rush hour now than they were at 3 a.m. just one month ago.
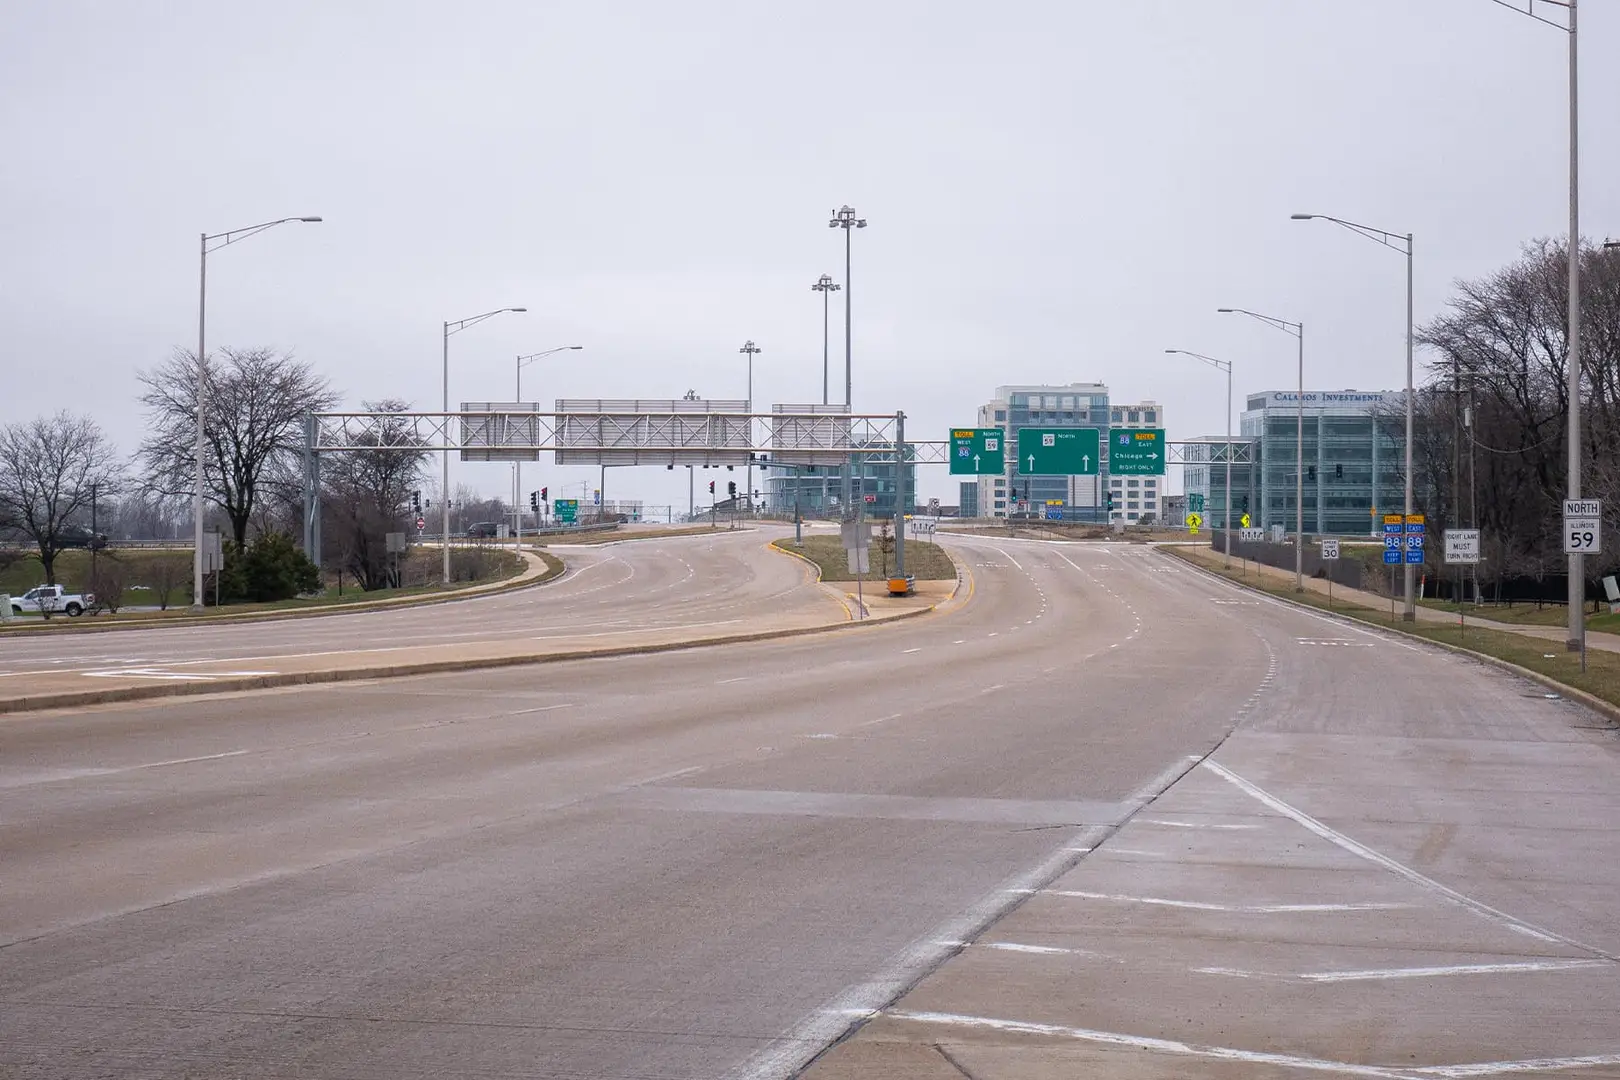
The Rt. 59/I-88 interchange in Naperville, IL is never this empty – except for now.
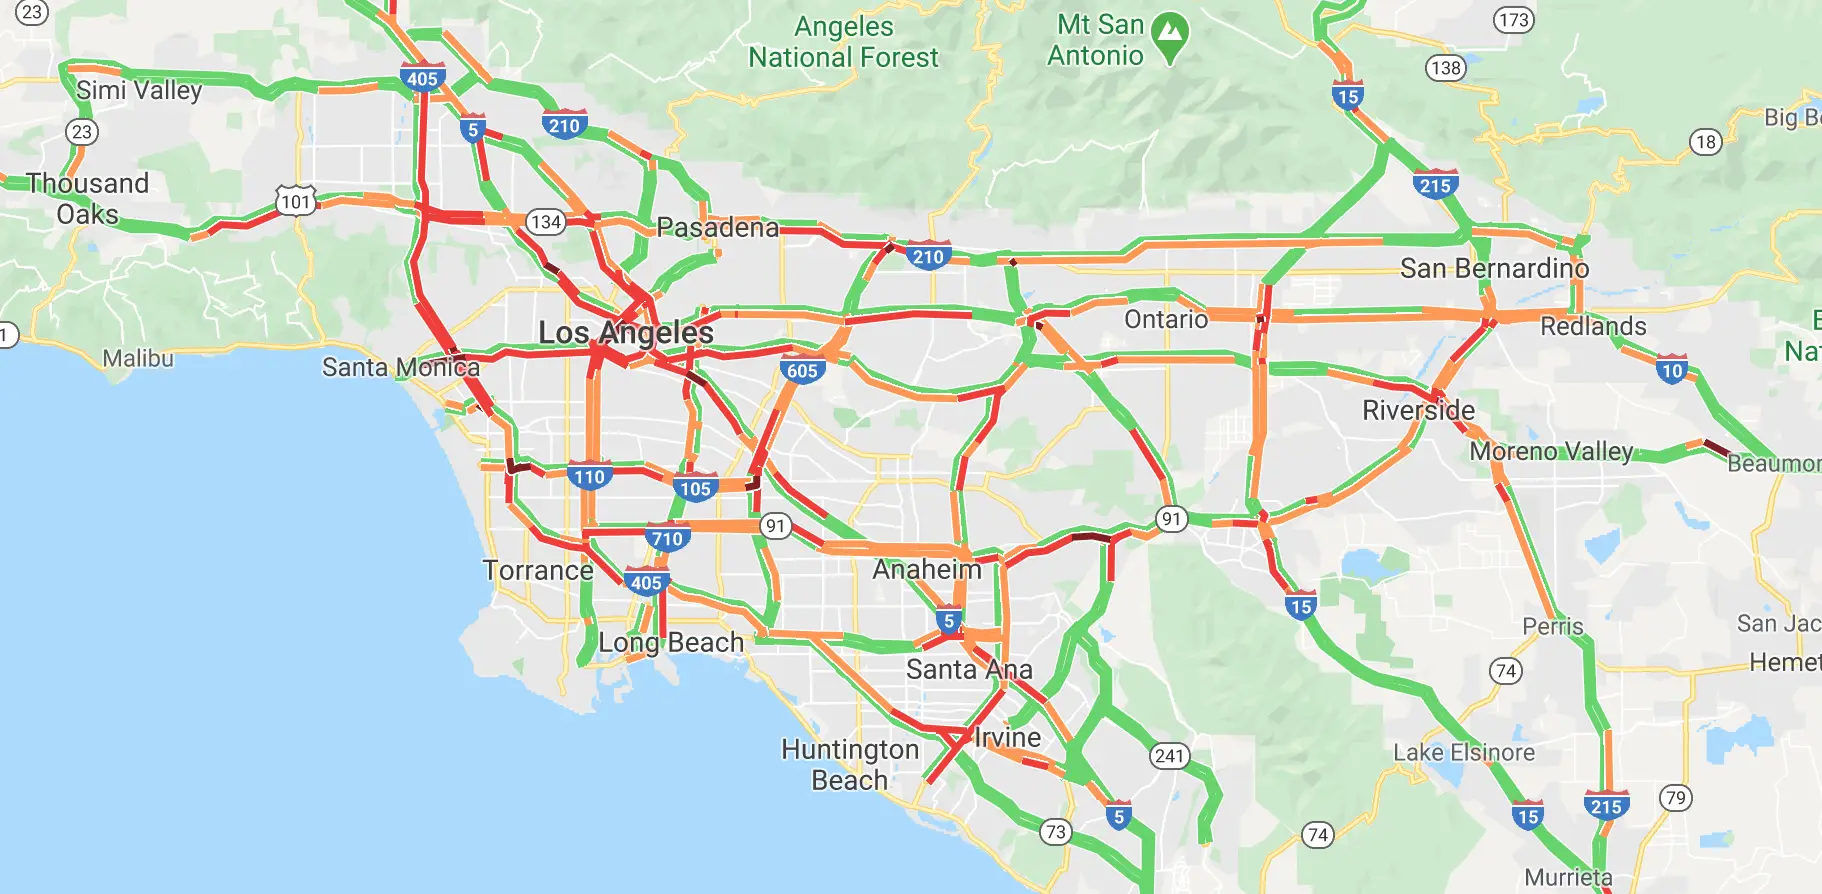
LA’s Normal Traffic
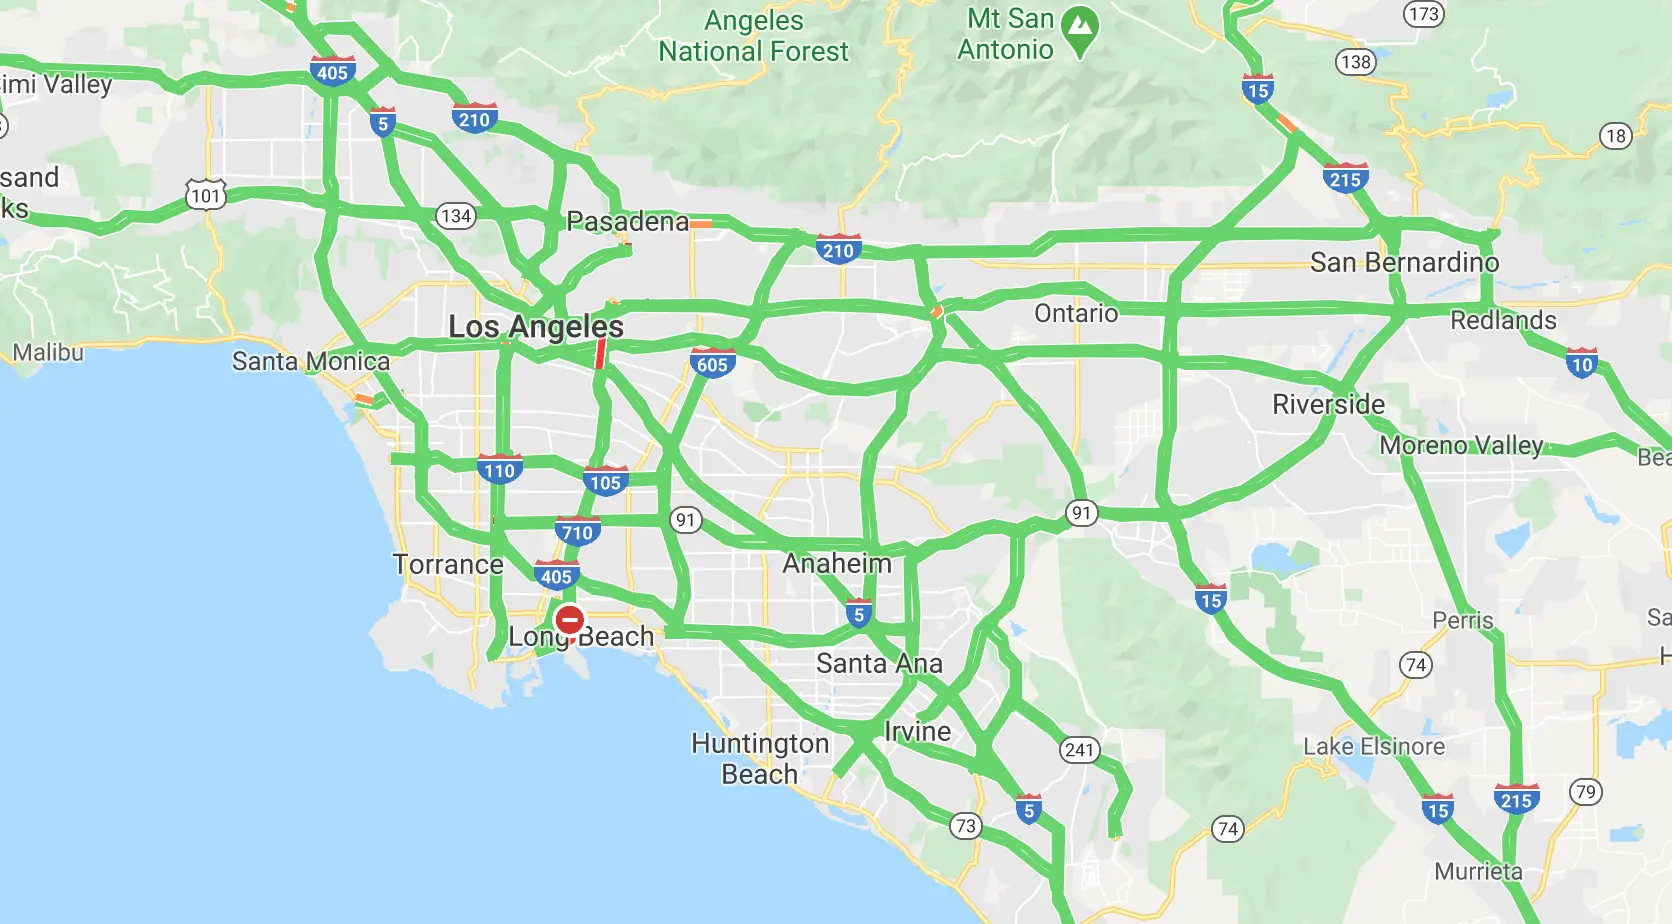
LA’s traffic during the pandemic.
Transportation is the single largest cause of both air pollution and greenhouse gas emissions in the United States. With less people and goods moving, there are less emissions being released into the atmosphere.
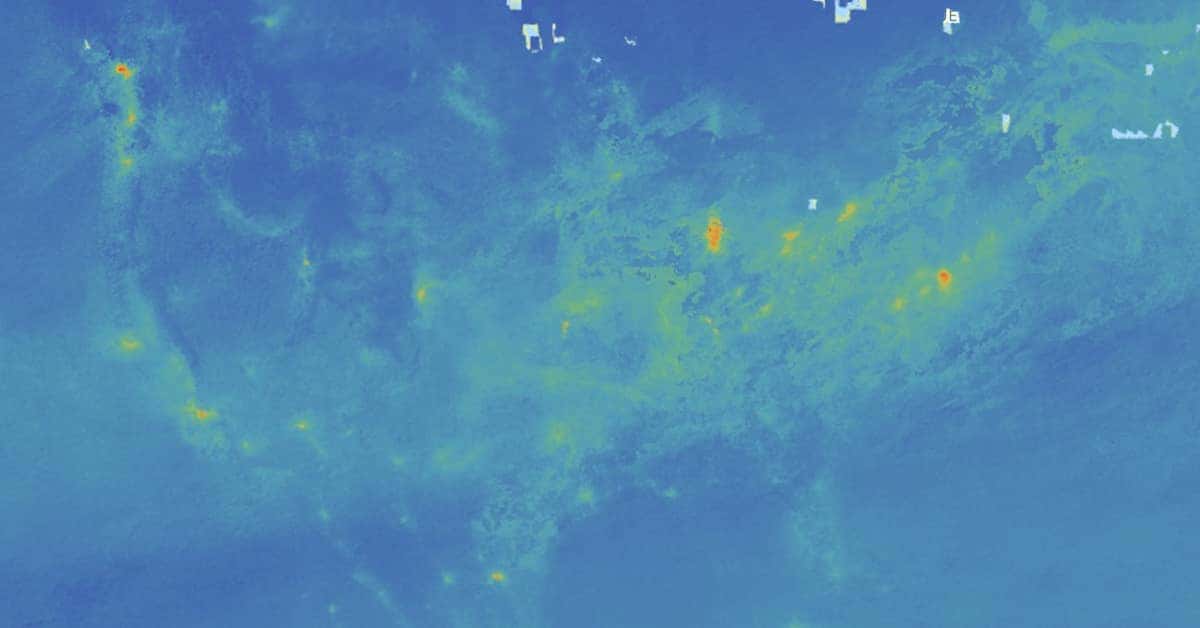
To illustrate that, Earther put together an interactive map of the United States that displays pollution (based on Nitrogen Dioxide levels) measured by the European Space Agency’s Sentinel-5P Satellite.
The map offers four views of the United States, measured on one date of each of the last four months: December 21, January 21, February 21, and March 20.
Pollution is steadily red over the major metros of America until it suddenly clears on the map from March.
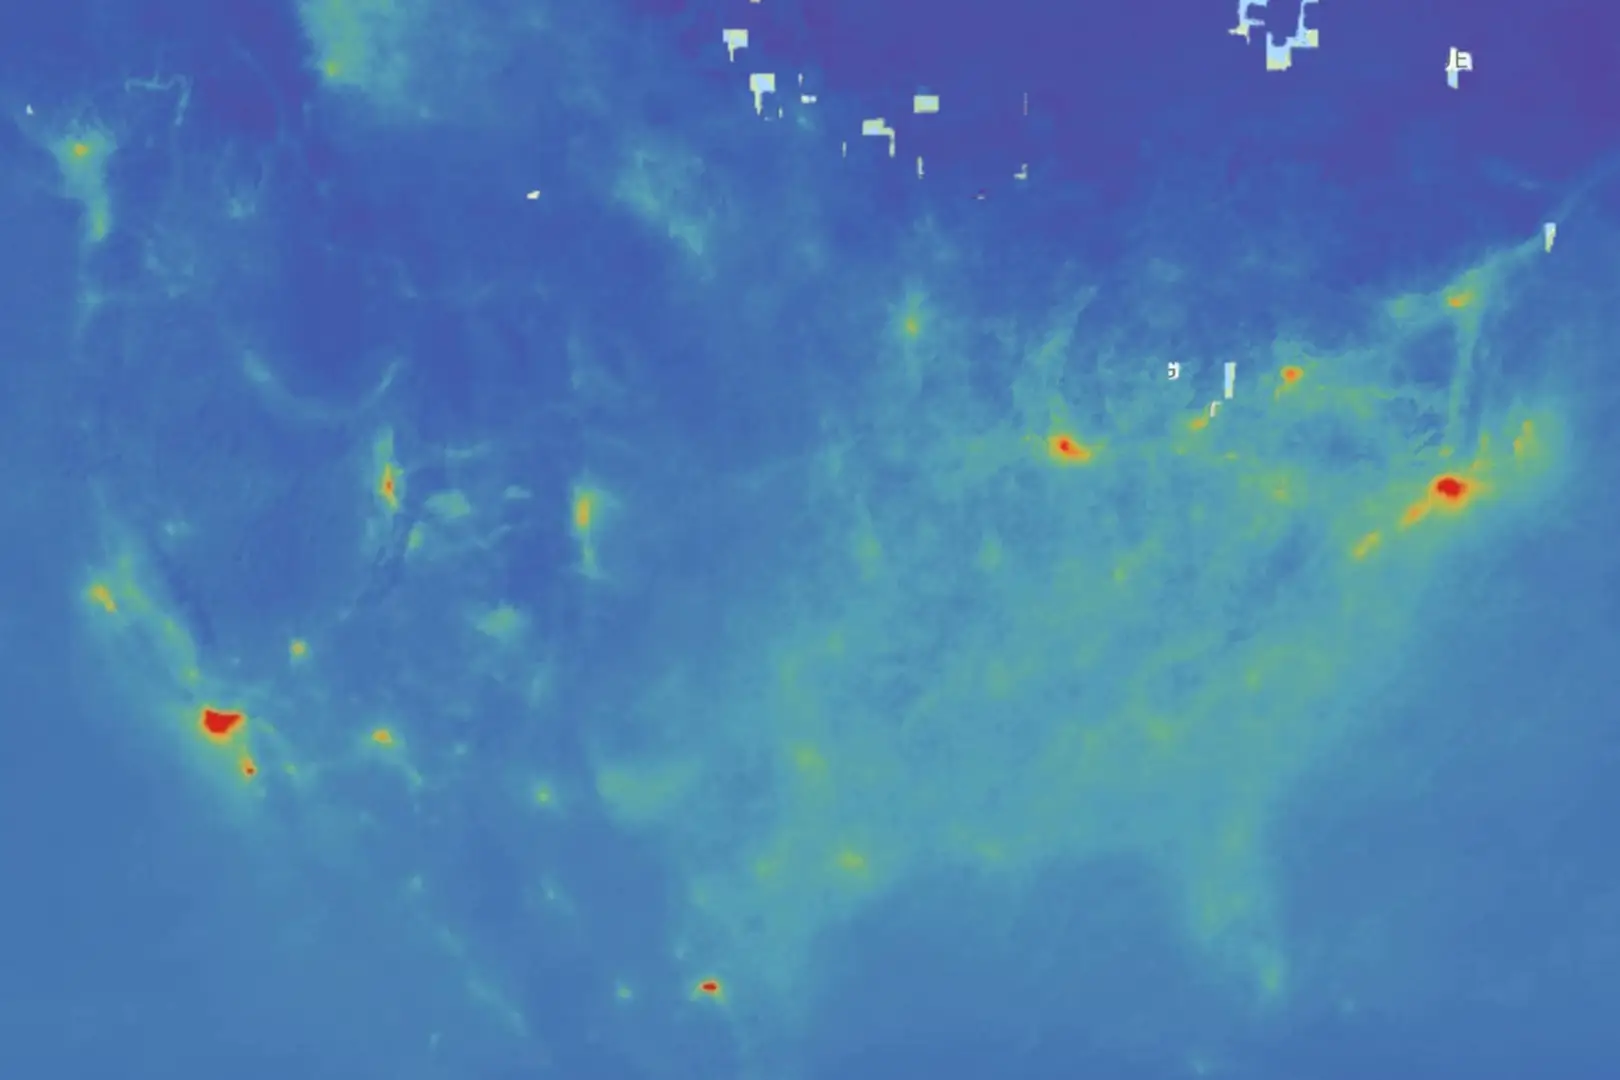
Snapshot taken January 21, 2020. Image: Earther G/O Media
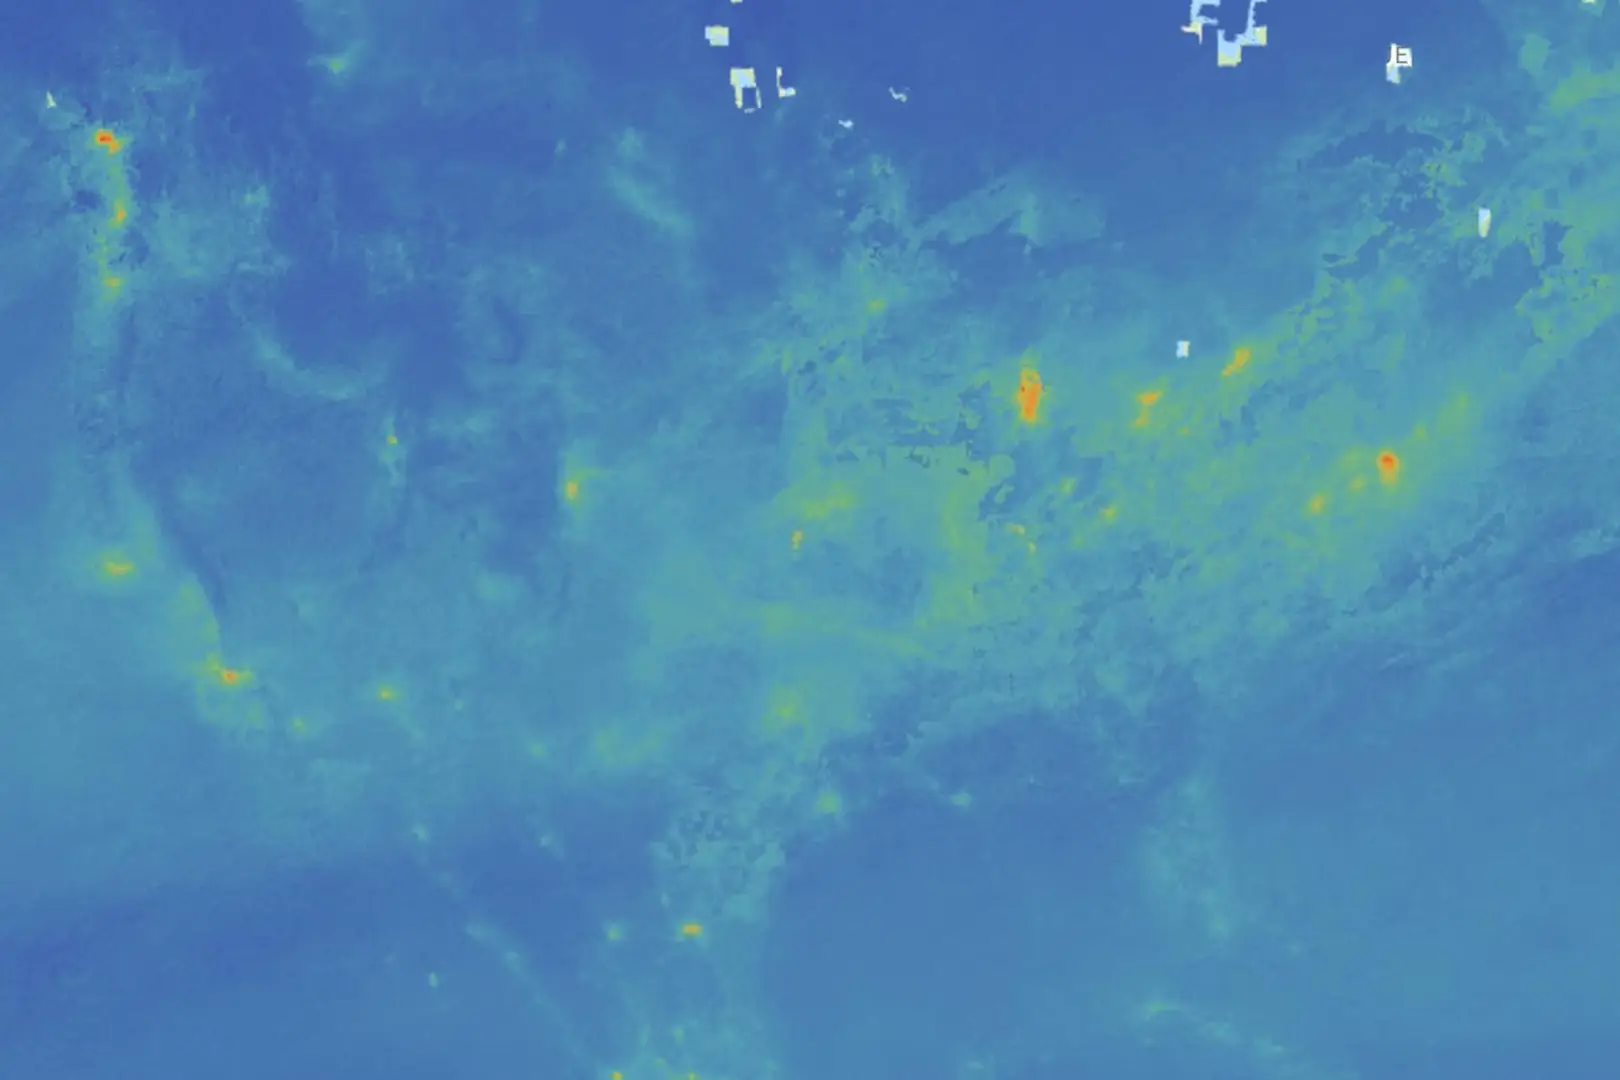
Snapshot taken March 20, 2020. Image: Earther G/O Media
While this is a somewhat solemn sign of our times, we can also choose to interpret it as an image of hope – a sneak preview of what a future with clean transportation looks like.
The fact from earlier about transportation being the single largest cause of emissions in the United States? That’s not hyperbole.
According to the EPA, transportation produces 29% of America’s carbon dioxide emissions.
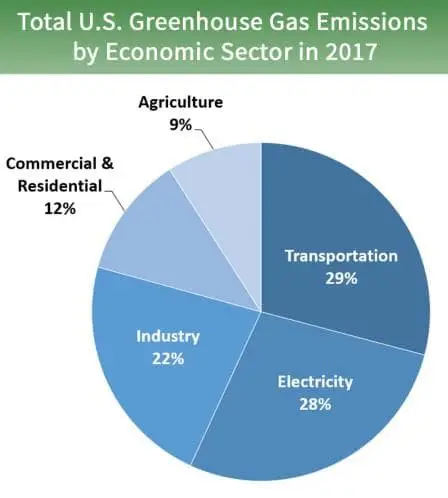
Image source: EPA
The transportation sector generates the largest share of greenhouse gas emissions. Greenhouse gas emissions from transportation primarily come from burning fossil fuel for our cars, trucks, ships, trains, and planes. Over 90 percent of the fuel used for transportation is petroleum based, which includes primarily gasoline and diesel.
While non-car transportation methods obviously make up a significant portion of that number, road-going vehicles alone make up a majority of nitrous oxide emissions in the United States at a whopping 54% of total emissions.

Image source: EPA
The EPA says that nitrous oxides irritate people’s lungs and are particularly dangerous to people with asthma and other respiratory diseases. The particulate pollution also contributes to hazy air, acid rain, and nutrient pollution in our waterways – which causes algae blooms and kills fish.
With all of the focus on Climate Change, it’s easy to forget that burning fuel is a dirty business that contributes to pollution in ways far beyond greenhouse gas emissions.
Cutting back on fossil fuel usage will do more for the environment and humanity than just reducing the impact of Climate Change.
Electric vehicles produce no tailpipe emissions and can be run entirely on clean energy as the electrical grid transitions to clean power.
Traffic-clogged highways which reek of exhaust fumes that scratch your lungs will be much less of an environmental disaster with electric cars on the road. The EPA’s studies will begin to note declines in Carbon Dioxide and Nitrous Oxide pollution as electric vehicles are adopted en masse.
These maps aren’t just a fun fact of our not-so-fun situation. They’re evidence that electrifying transportation will lead to a better future.
0 comment(s) so far on You see less air pollution. We see the future thanks to clean transportation.